personal blog of ryan robitaille
  • @ryrobes
  • Data Rabbit
  • CanvaSQL
  • Rabbit Remix
  • reClojure 2022 Talk
  • Old Blog
Sign in Subscribe

Storytime

A collection of 2 posts
The Color & Shape of Data: Living Maps, Direct Manipulation, the Code Canvas
Data Rabbit Featured

The Color & Shape of Data: Living Maps, Direct Manipulation, the Code Canvas

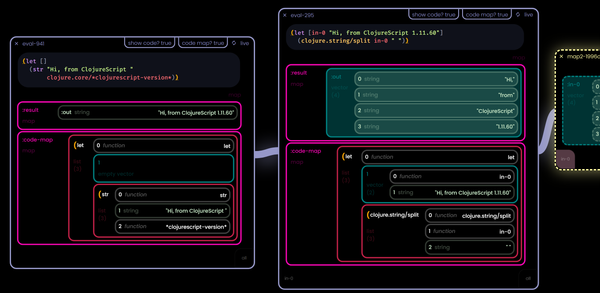
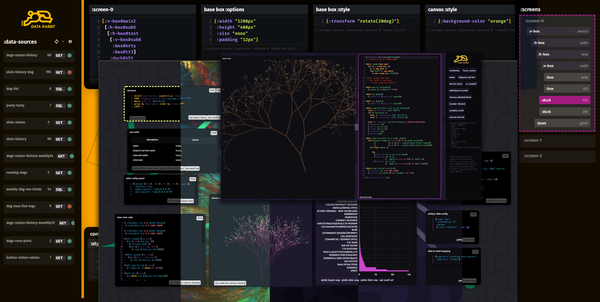
What do you see when you are creating? Do you keep a model in your head or does your tool or language impose one upon you? What does it look like? Does it take the form of a whiteboard, is it purely textual, a series of floating shapes, bricks, magnetized
03 Jul 2023 10 min read
Tools. Chisels. Bar Graphs. Zuckerbergs. Rabbits. Ceilings.
Data Rabbit Featured

Tools. Chisels. Bar Graphs. Zuckerbergs. Rabbits. Ceilings.

A story, a mission, and a new way forward. Where have I been and what now? What a long and eye-opening journey it has all been. Plus a thread about the nature of tools...
01 Aug 2020 7 min read
Page 1 of 1
personal blog of ryan robitaille © 2025
Powered by Ghost