Pivoting into new flows - life, location, Rabbit
The true life blood of a "data app" is the flow of data through all the components + how they relate to each other in the world...

Over a year since the last post here? Damn.
Needless to say, a lot has happened - moved out of the Bay Area, new day job, some serious life stuff, etc. Given how tough the last couple years have been for all, I'm sure there are many other stories like it.
Confusing times. Hard times. Enlightening times. Anyways - as much has changed - I've never stopped iterating on my Data Rabbit project. This has become less of a blog - rather a personal diary of it's development history.
I don't even know how many iterations I've gone through in terms of UI and backend micro-pivots over the years. It's funny how throwing away interfaces, ideas, code and refactoring so often feels like failure, at least at first - but is essentially just refining and rediscovering you own project.
What's the phrase in regards to literature - don't be afraid to "kill your darlings"?
Painful, but you learn much more about what you are building in this process.
In fact, without being 100% aware of it at the time, I basically flipped the entire perspective of the tool on it's side.
From:
"a editable configuration-based system of pre-fabricated blocks, thoughtfully assembled"
to
"A river of REPLs" - blocks that can render UI, execute backend code, and pass that output to other blocks. Thus creating a set of "primitives" that more complex systems can be built out of.
- Read
- Eval
- Visualize / Display (?)
- Loop
I just wanted to drop a quick update on some of those changes - and tease that a much larger set-by-step demo video will be released soon - followed by an Alpha1 version that everyone can use and run locally and hopefully give me some (constructive) feedback on.
As I was saying - looking at my previous posts on DR, I focused a lot on presentation and composition of pre-defined 'bespoke' elements, while still keeping a "live-coding / live-config IDE" type feel.
Still somewhat close to the metal, but with very defined guardrails...
But at some point I realized, while all that is well and good...
The life blood of a [dashboard, data experiment, viz story, query set, whatever] is the flow of data through all the (individual and simple) components + how they relate to each other in the overall world.
Only then does some form of "visual composer" actually take center stage.
Ah, so now we are back to "visual composition", so it shares some familiarity with my old approached but at the same time... not at all.
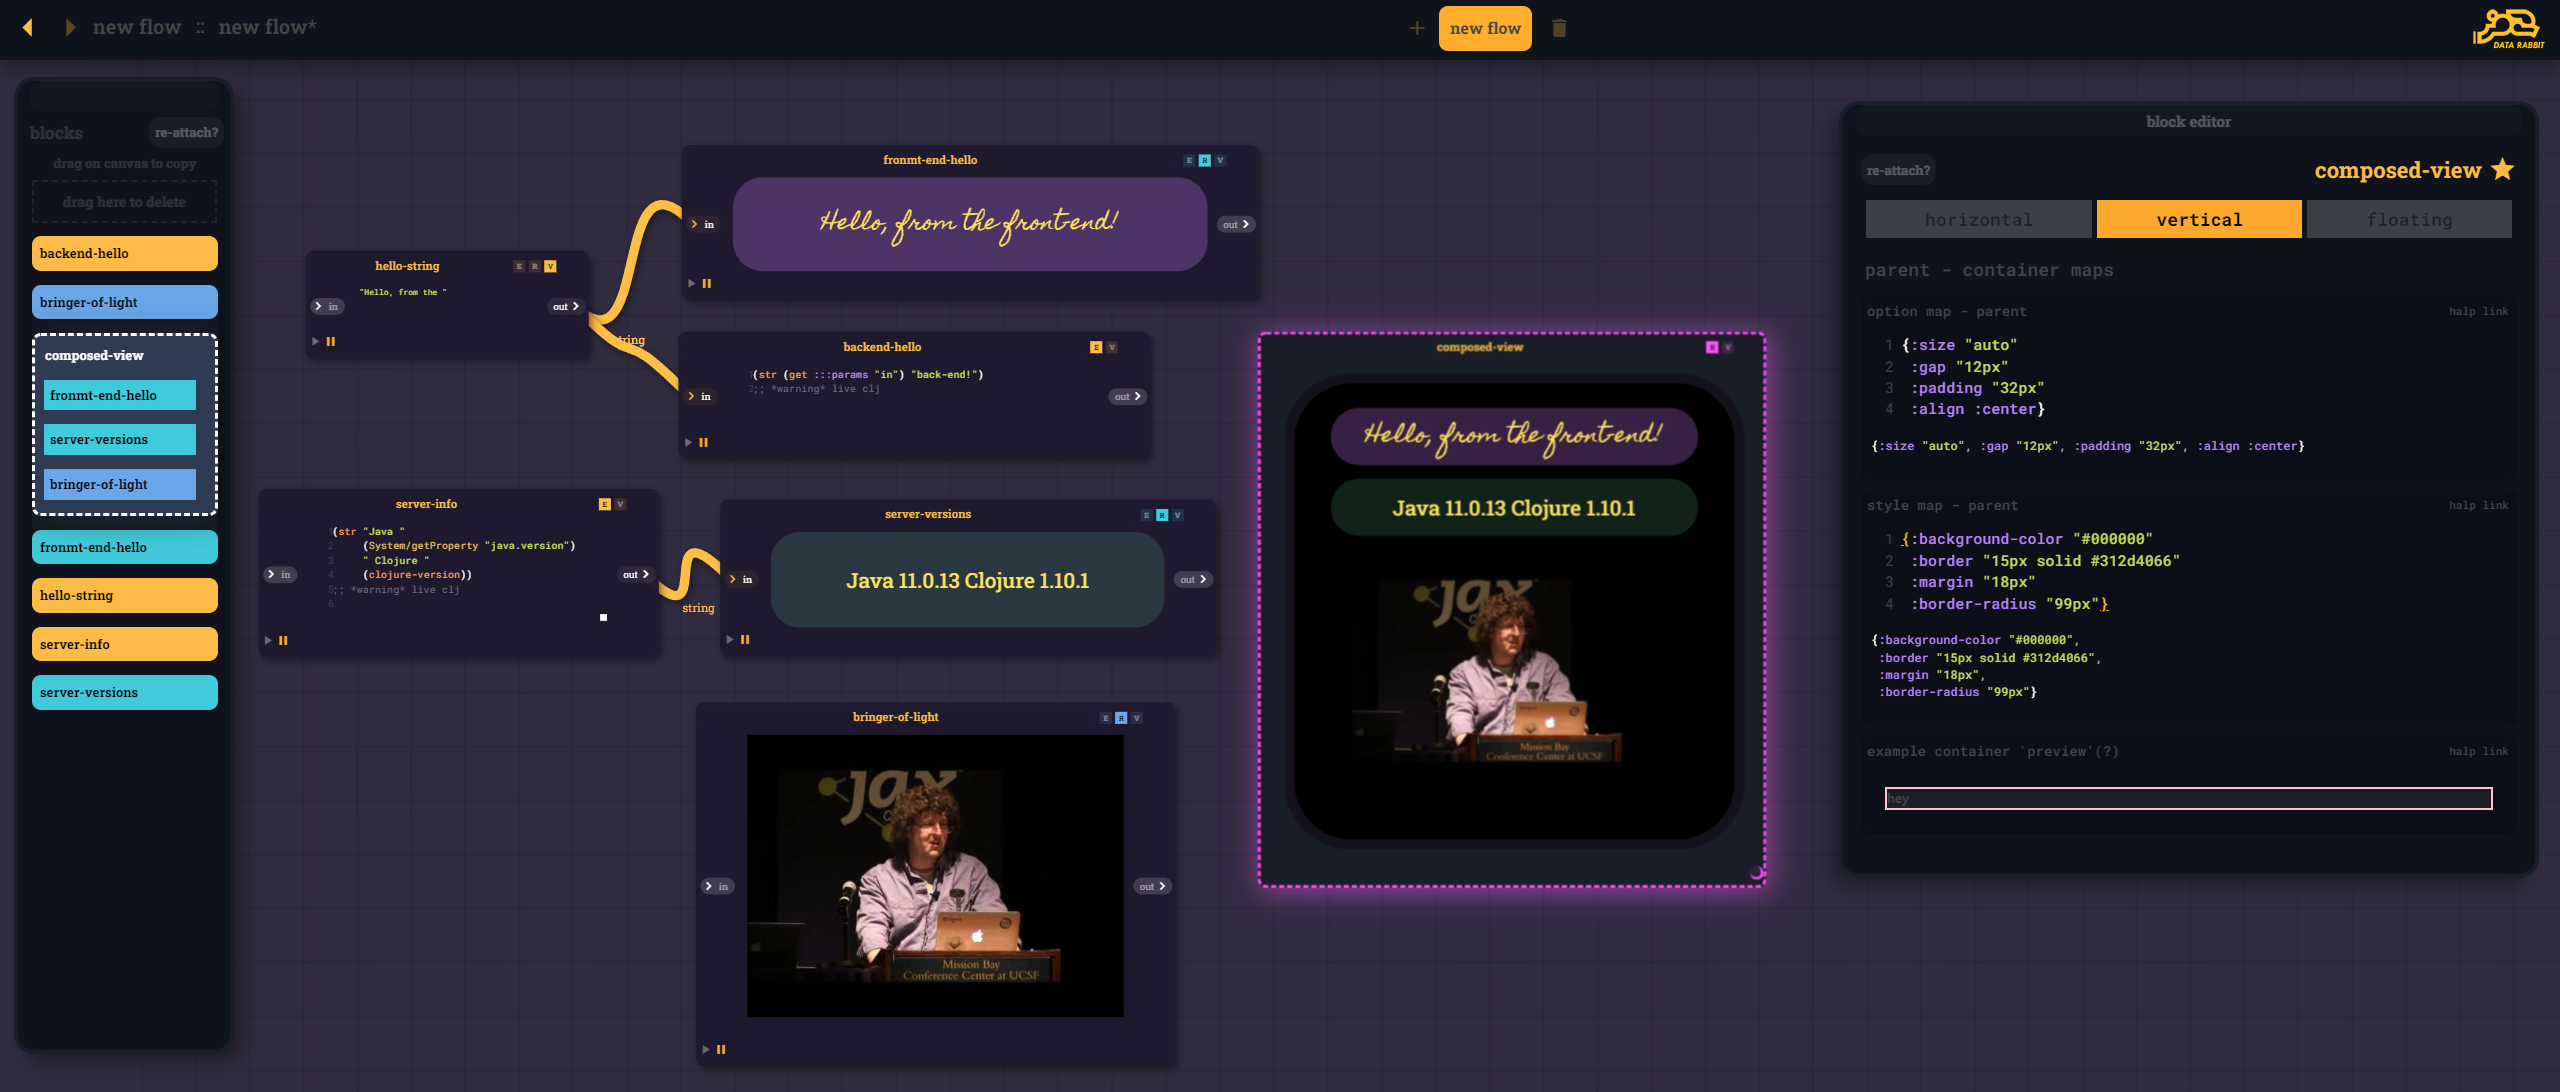
Note the block / layer navigator on the left - "composed-view" being a container for the previously defined CLJS and CLJ blocks - separating the logic of the block itself from the formatting as much or as little as you want.
A composed view block is just yet another block on the Rabbit canvas alongside the more "mechanical" blocks - as opposed to it being the canvas itself.
Of course we retain the ability to do compound recursive composition. With Horizontal, Vertical, and free-floating layouts - nested in each other...
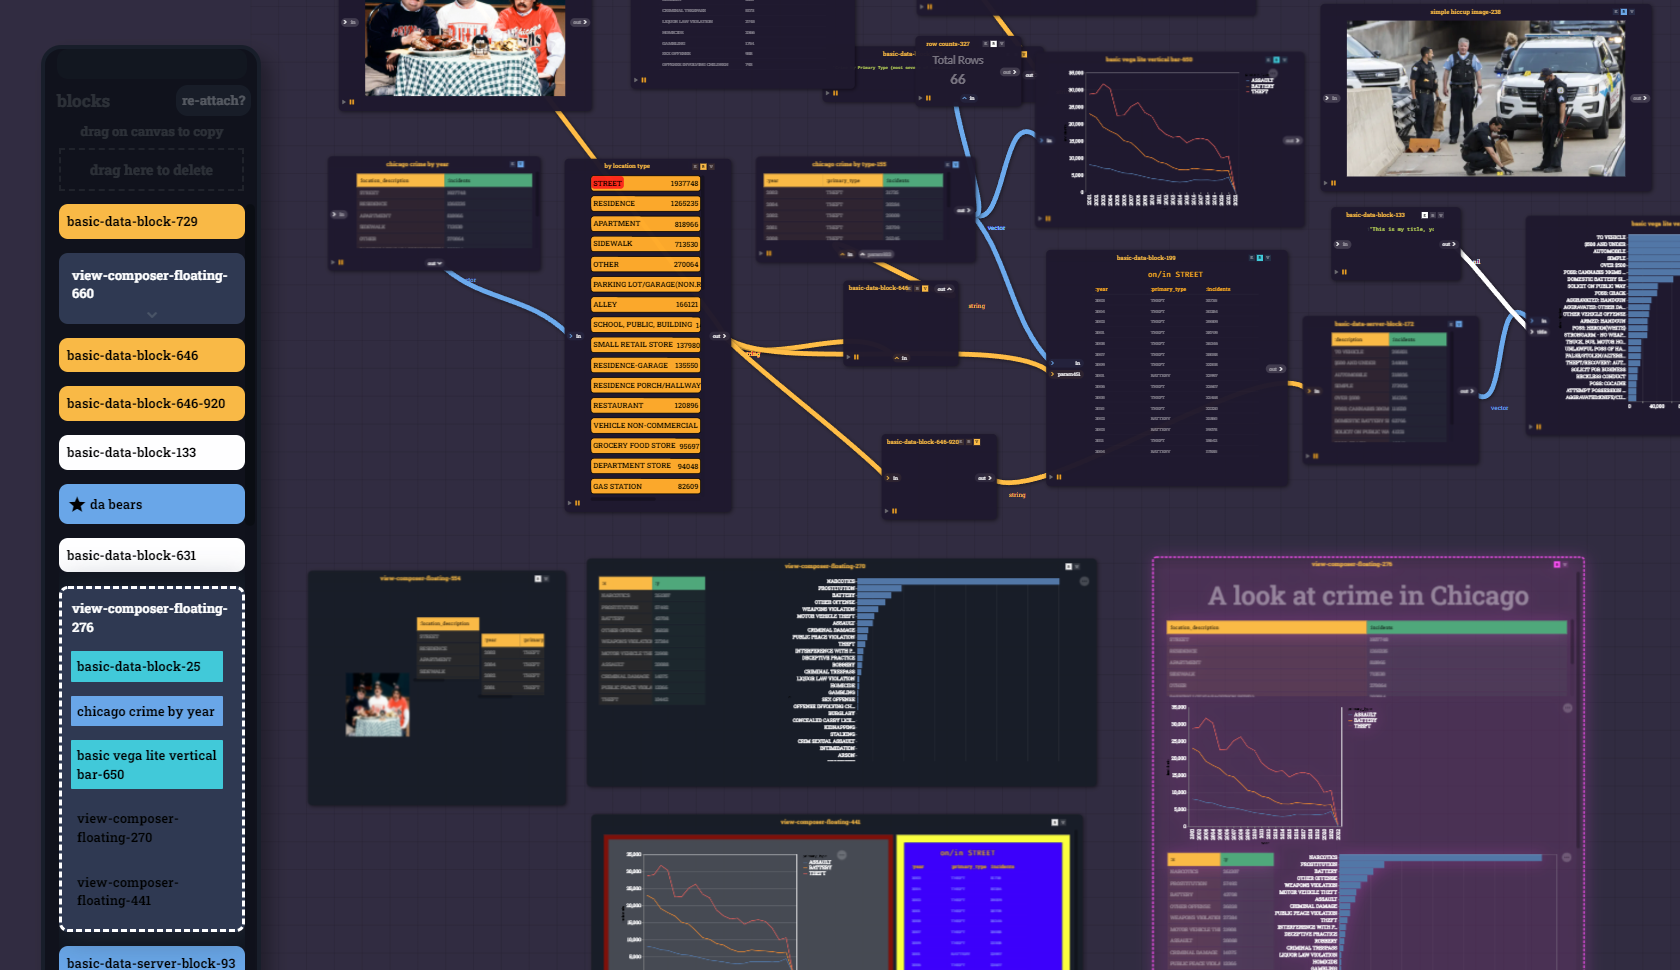
And obviously, this wouldn't be very useful without blocks being able to "talk" to other block via UI elements. Enabling cascading filters and all sorts of other interesting interaction. The difference is you can SEE the interconnections playing before you put the output blocks together to form a presentation block...
That being said, the core of the user-experience is now a series of "flow blocks" passing parameters and output (Reactions) from one to another.
- Some blocks execute code on the server w CLJ
- others render on the front-end w CLJS (with hiccup, re-com, vega, whatever)
Exposing all these REPLs makes things much more complicated than the "pre-fab with EDN config" blocks I was using before - but it opens up so much more opportunity.
Since now everything - UI elements, charts, server-side JDBC connections, SQL strings, Machine Learning process blocks - are made up of the same "stuff" and can be saved piece by piece and re-assembled in new and interesting ways.
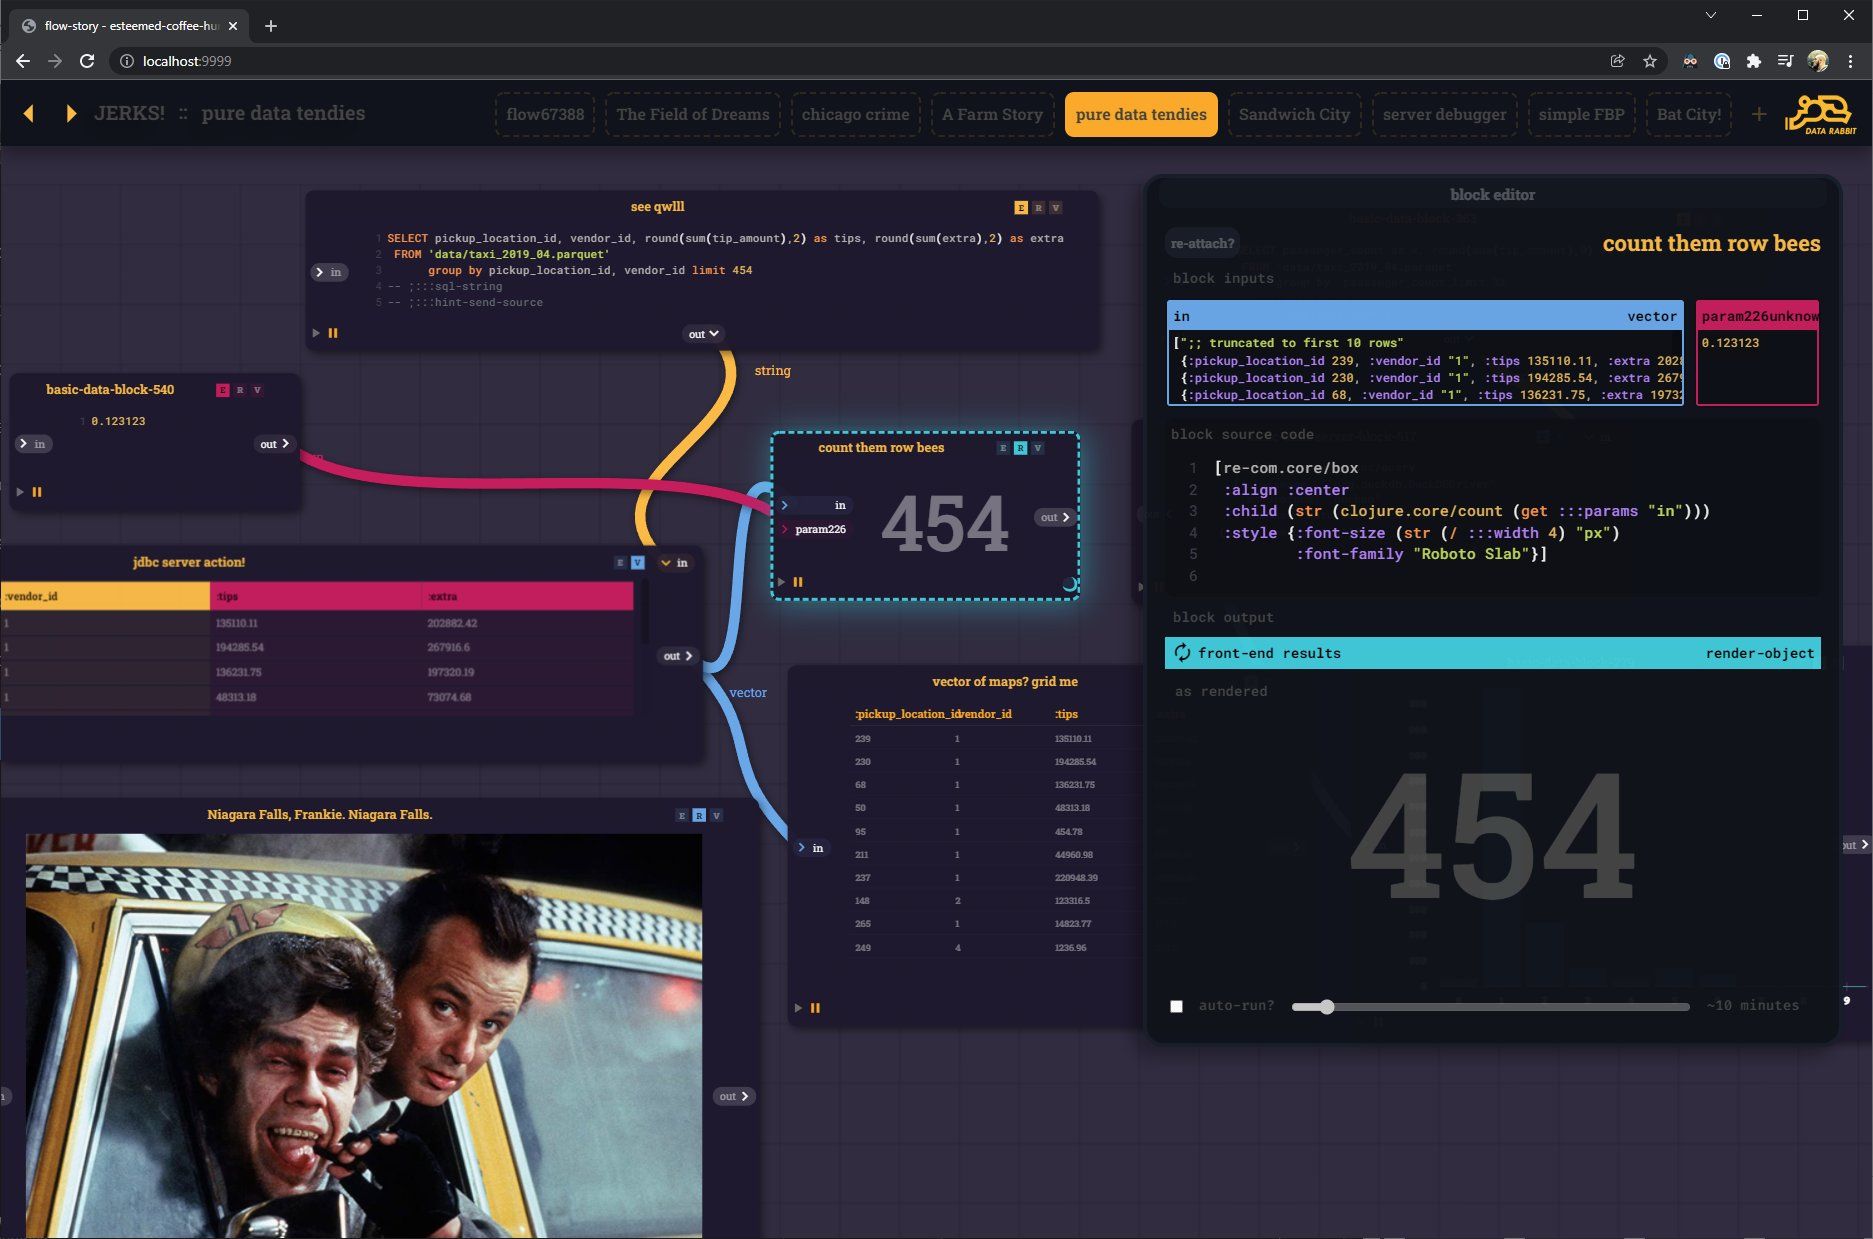
(was watching Scrooged that day, for the 100th time. "Niagara Falls, Frankie")
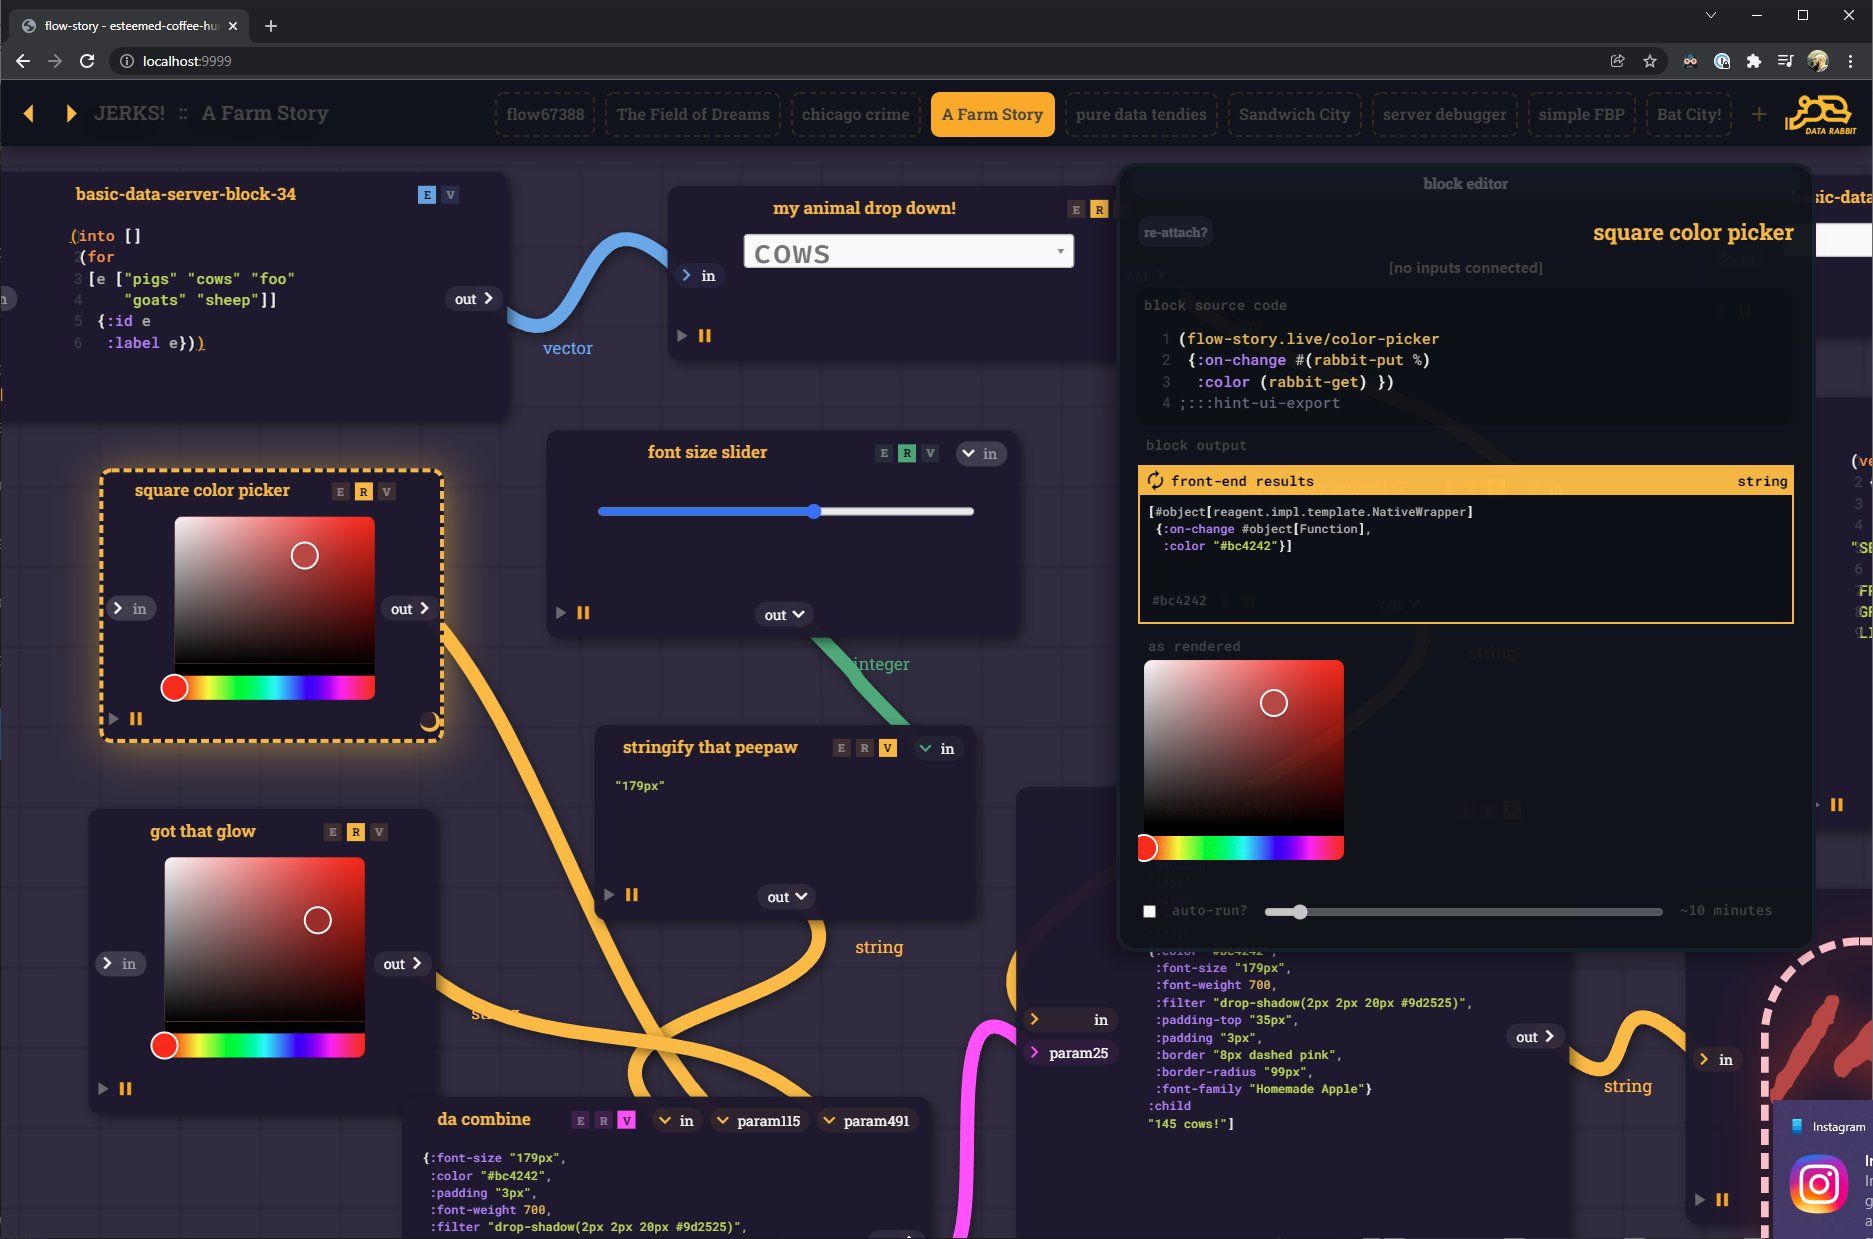
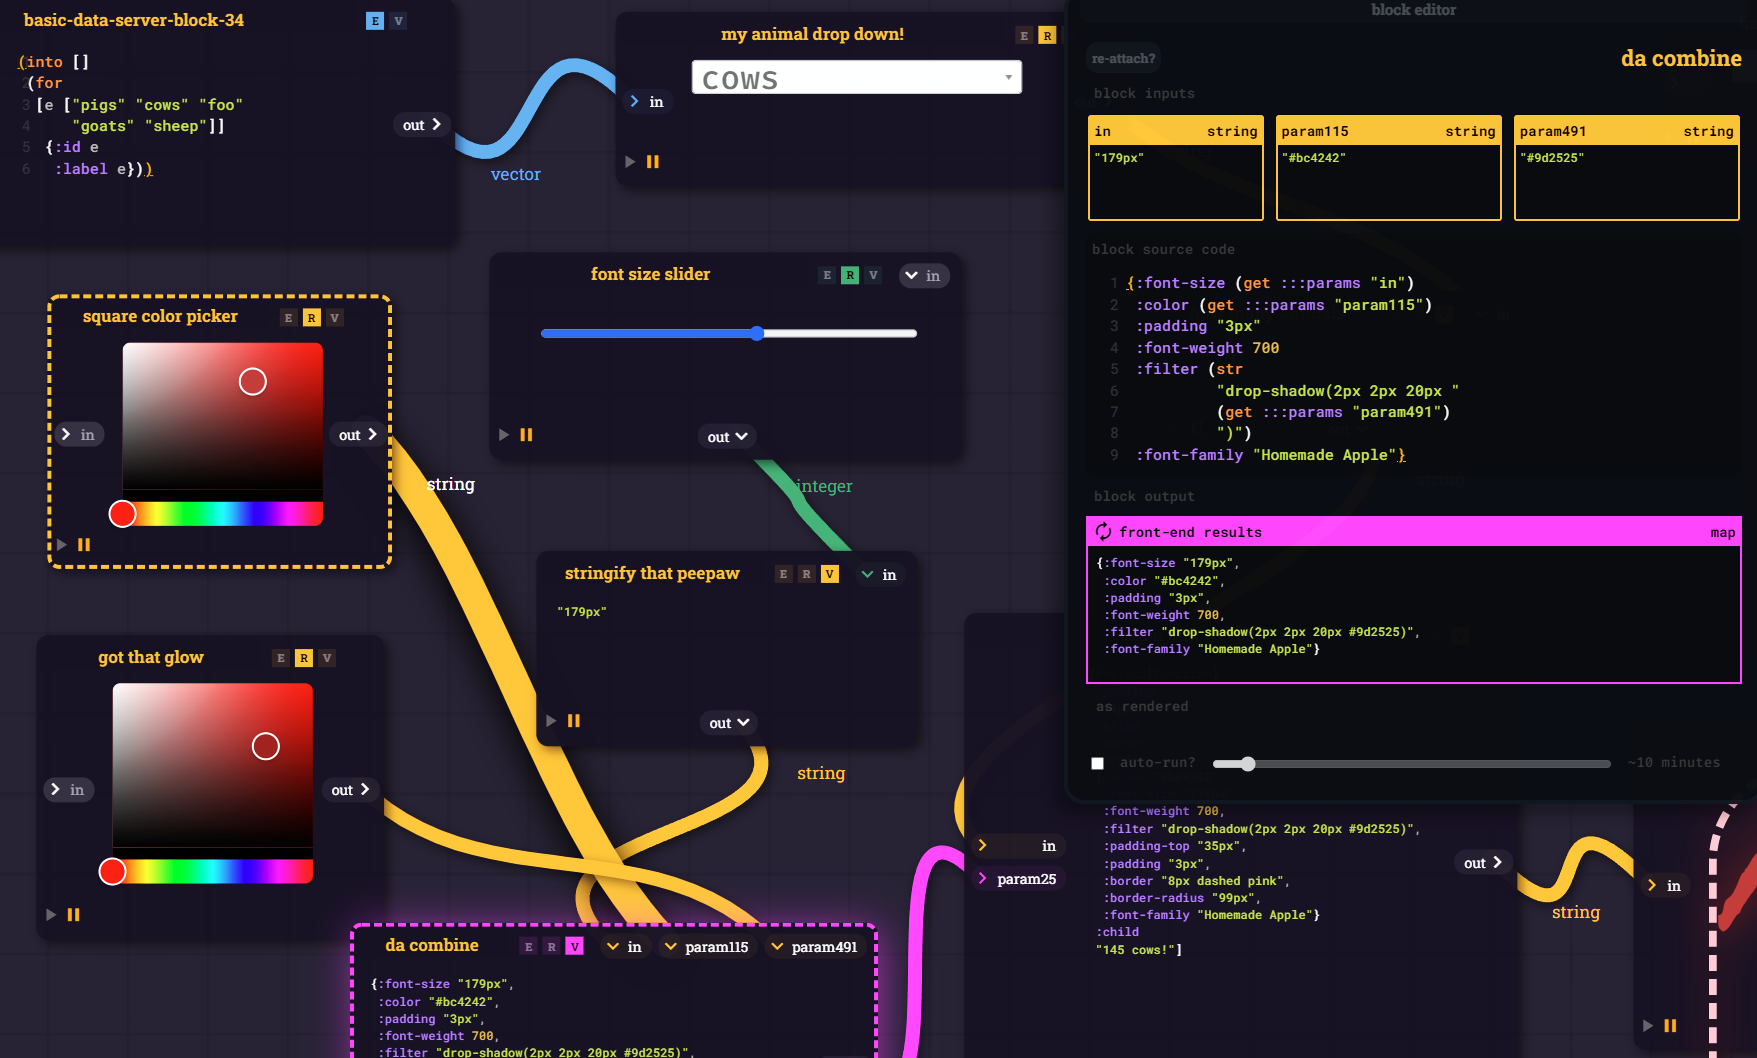
CLJS blocks that not only render the UI input dialog (in this case - sliders and color pickers) but also send the output as a parameter. No real hidden magic, just several forms of input and output - working together how you would expect.
Affordable 8k Monitors can't come soon enough! I've got a river of REPLs to visualize. The real Buffy understands.
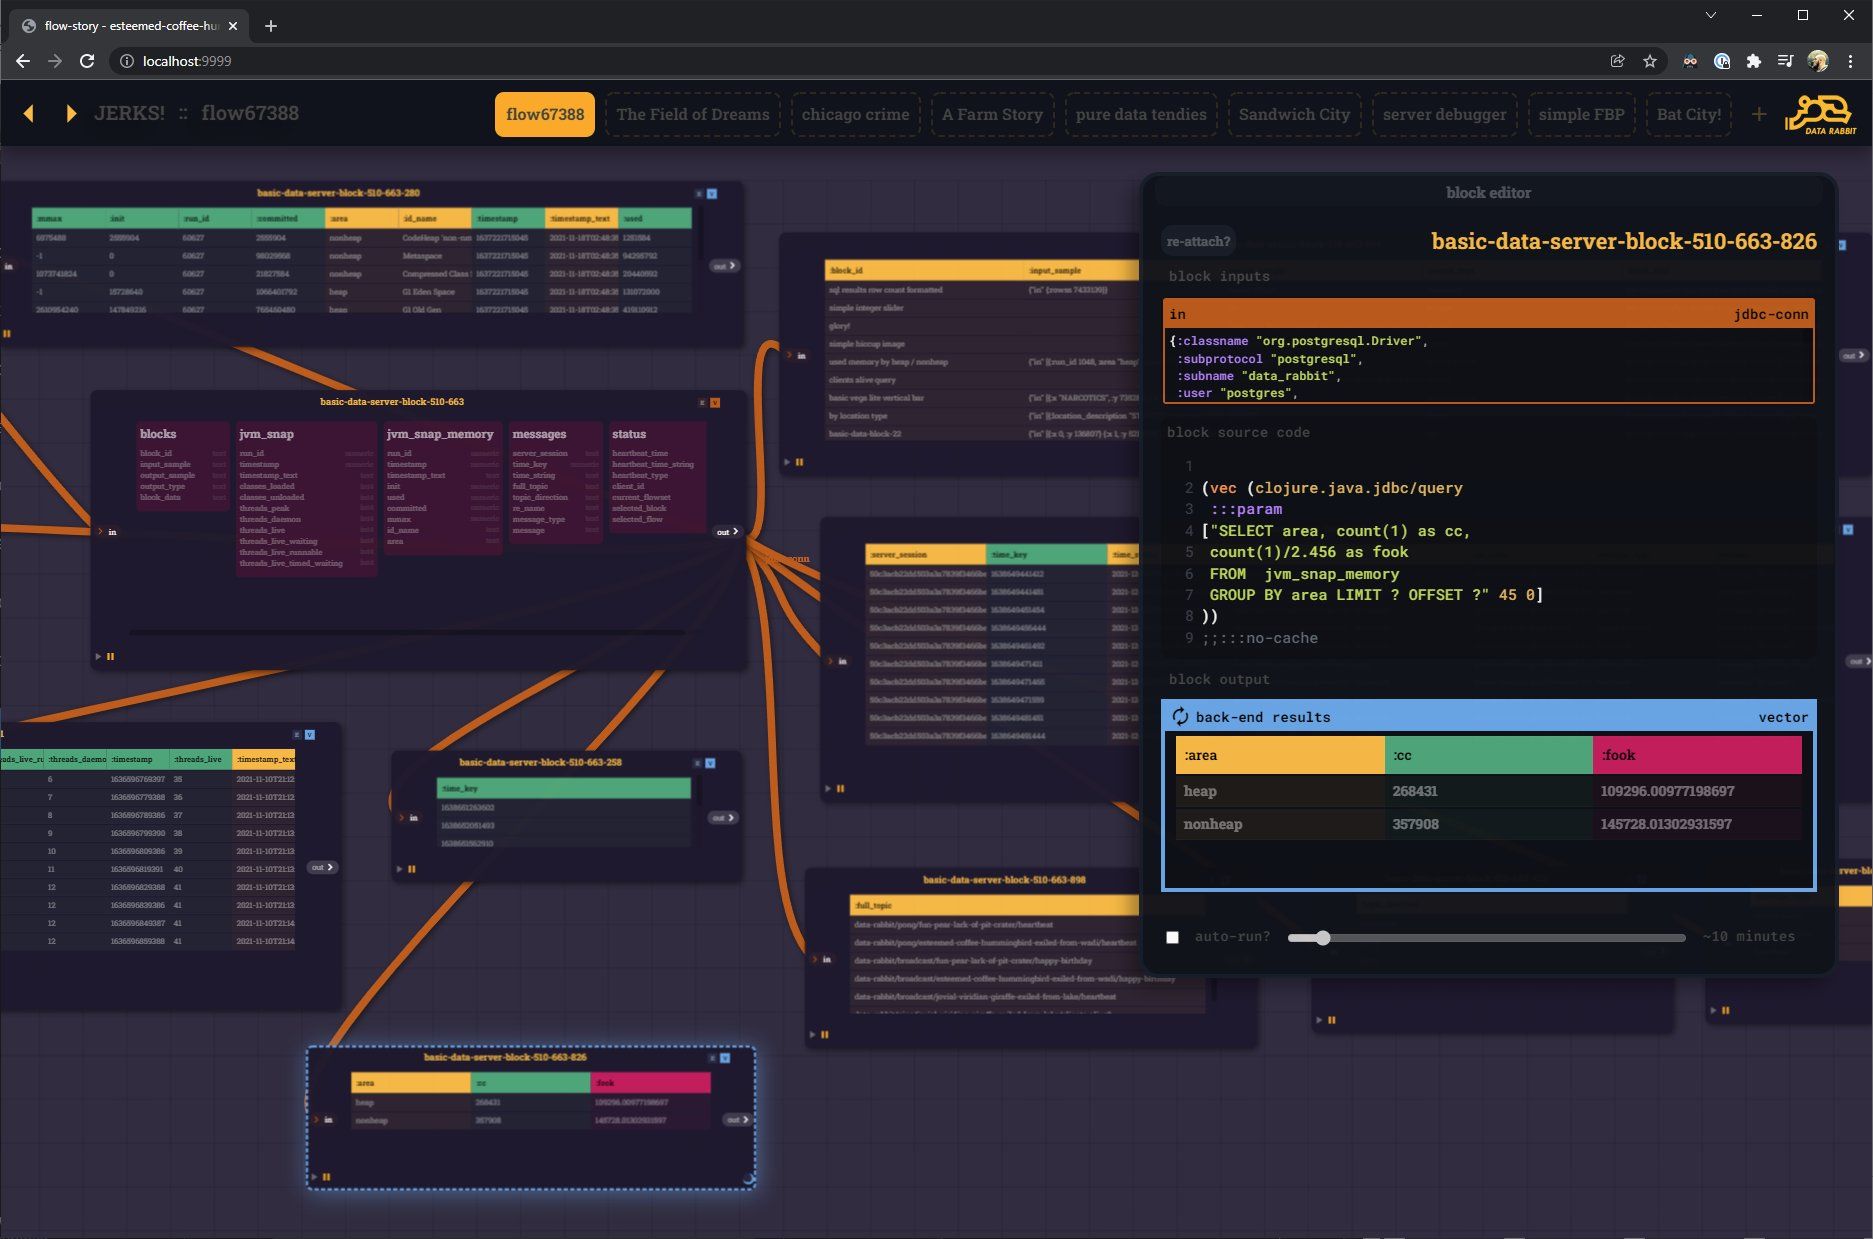
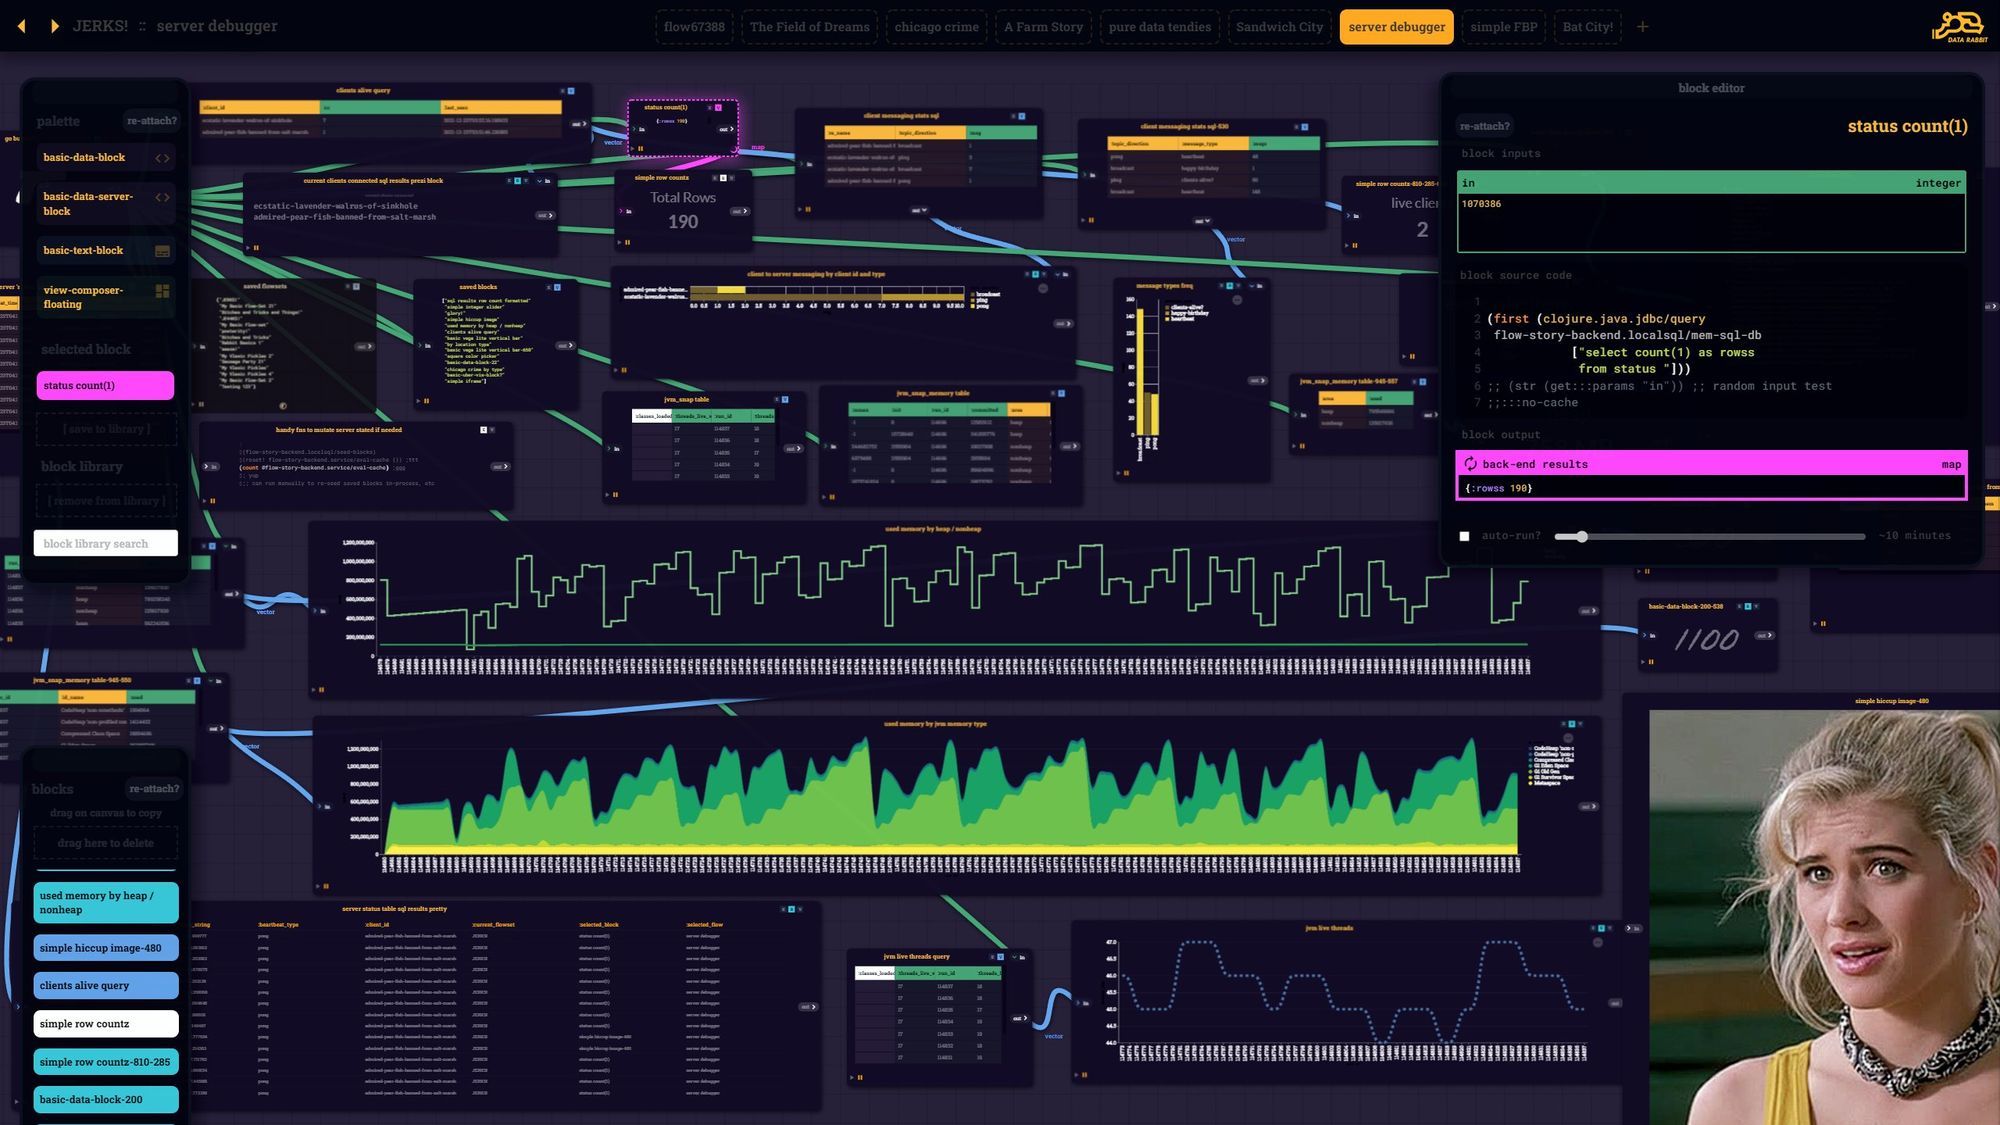
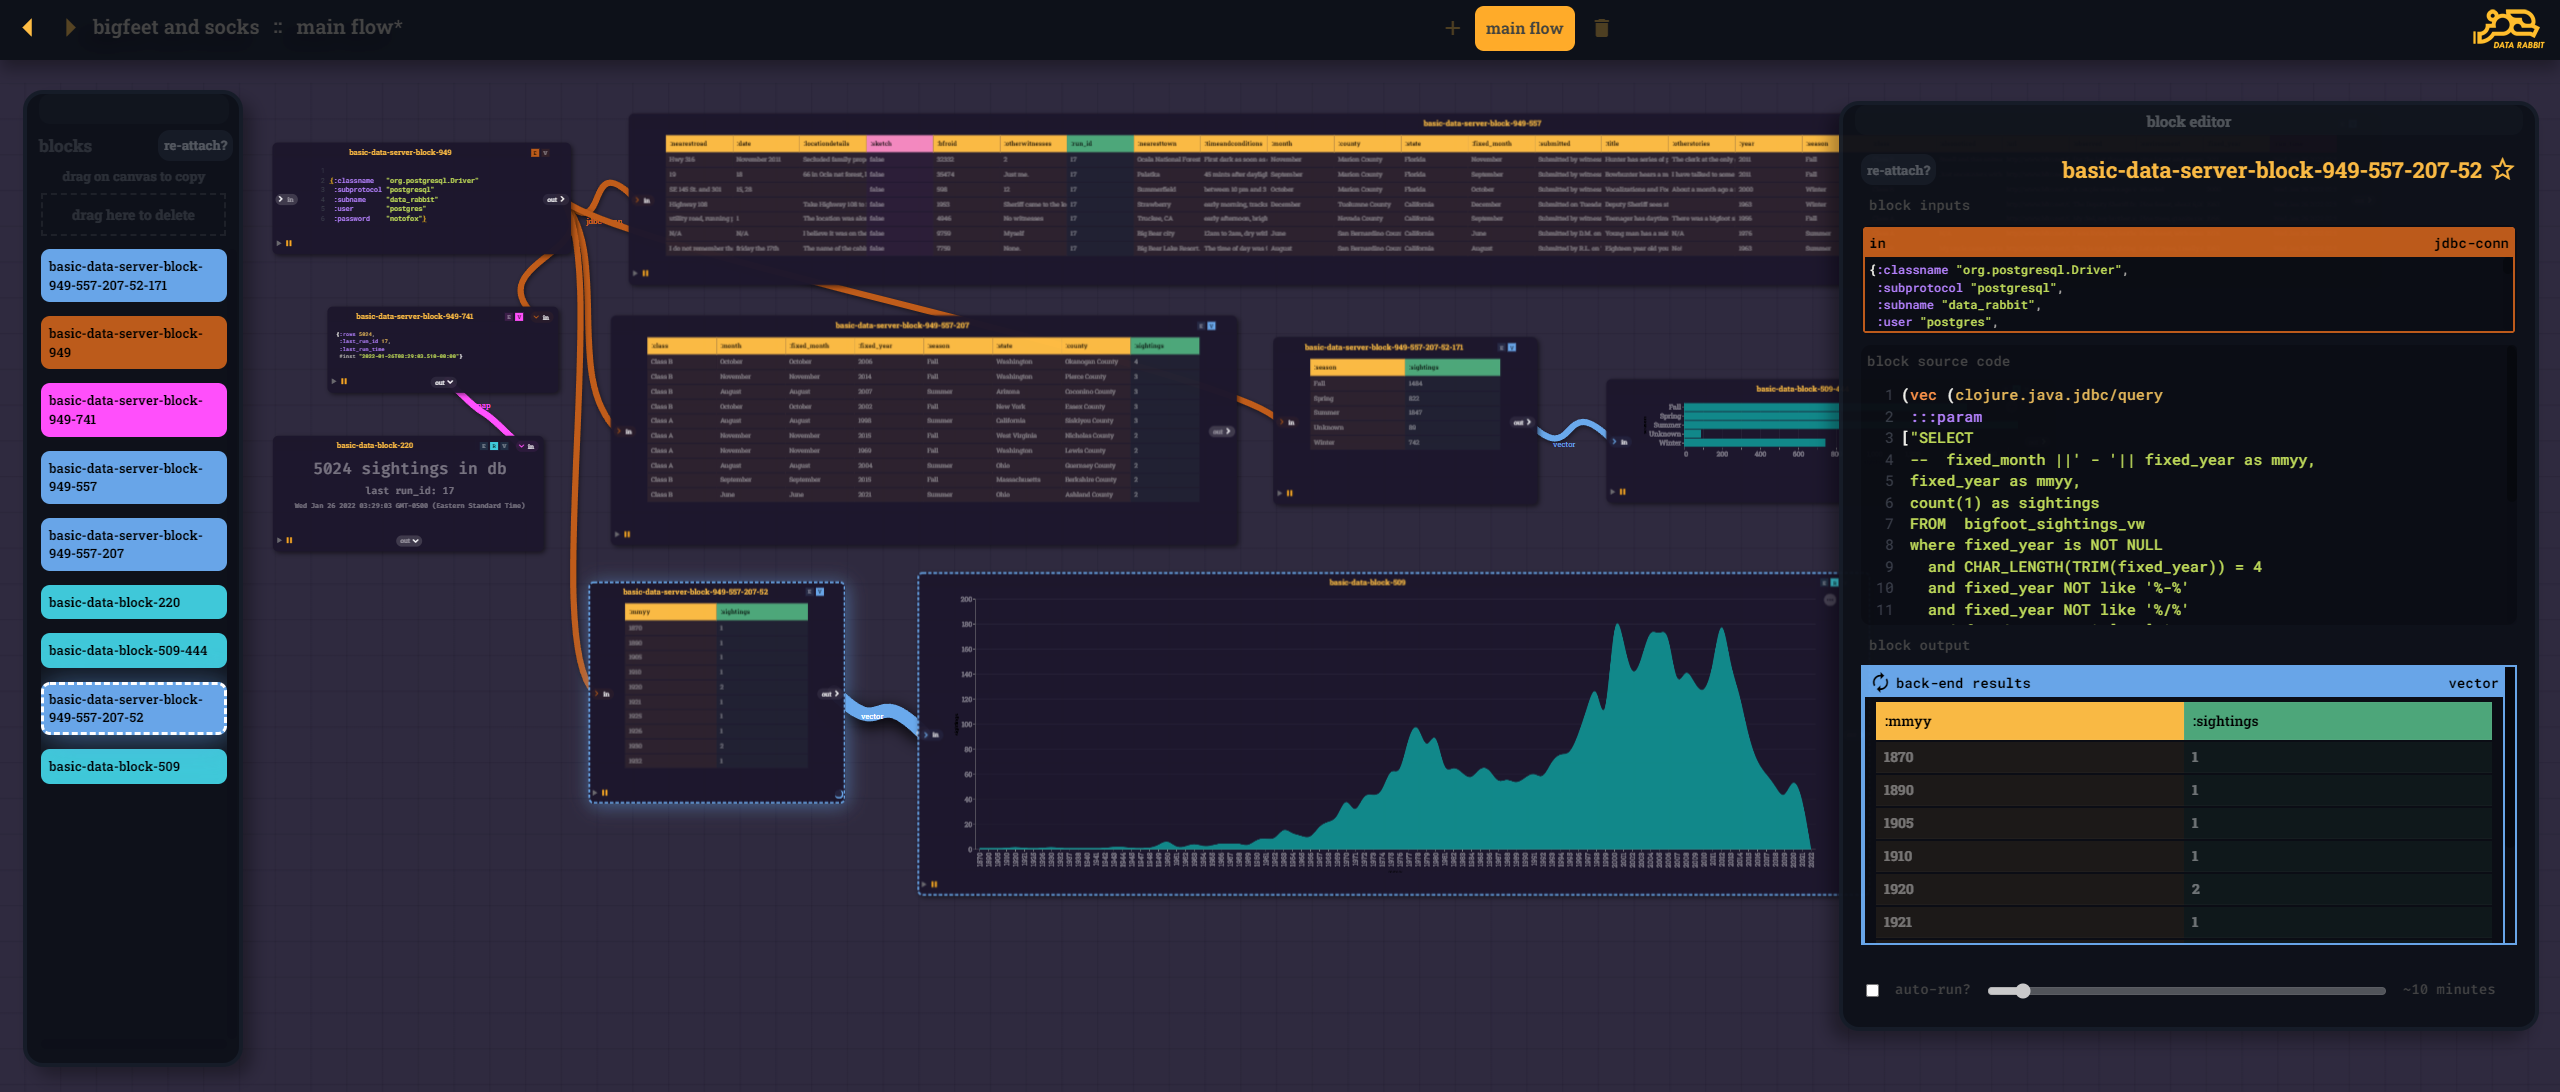
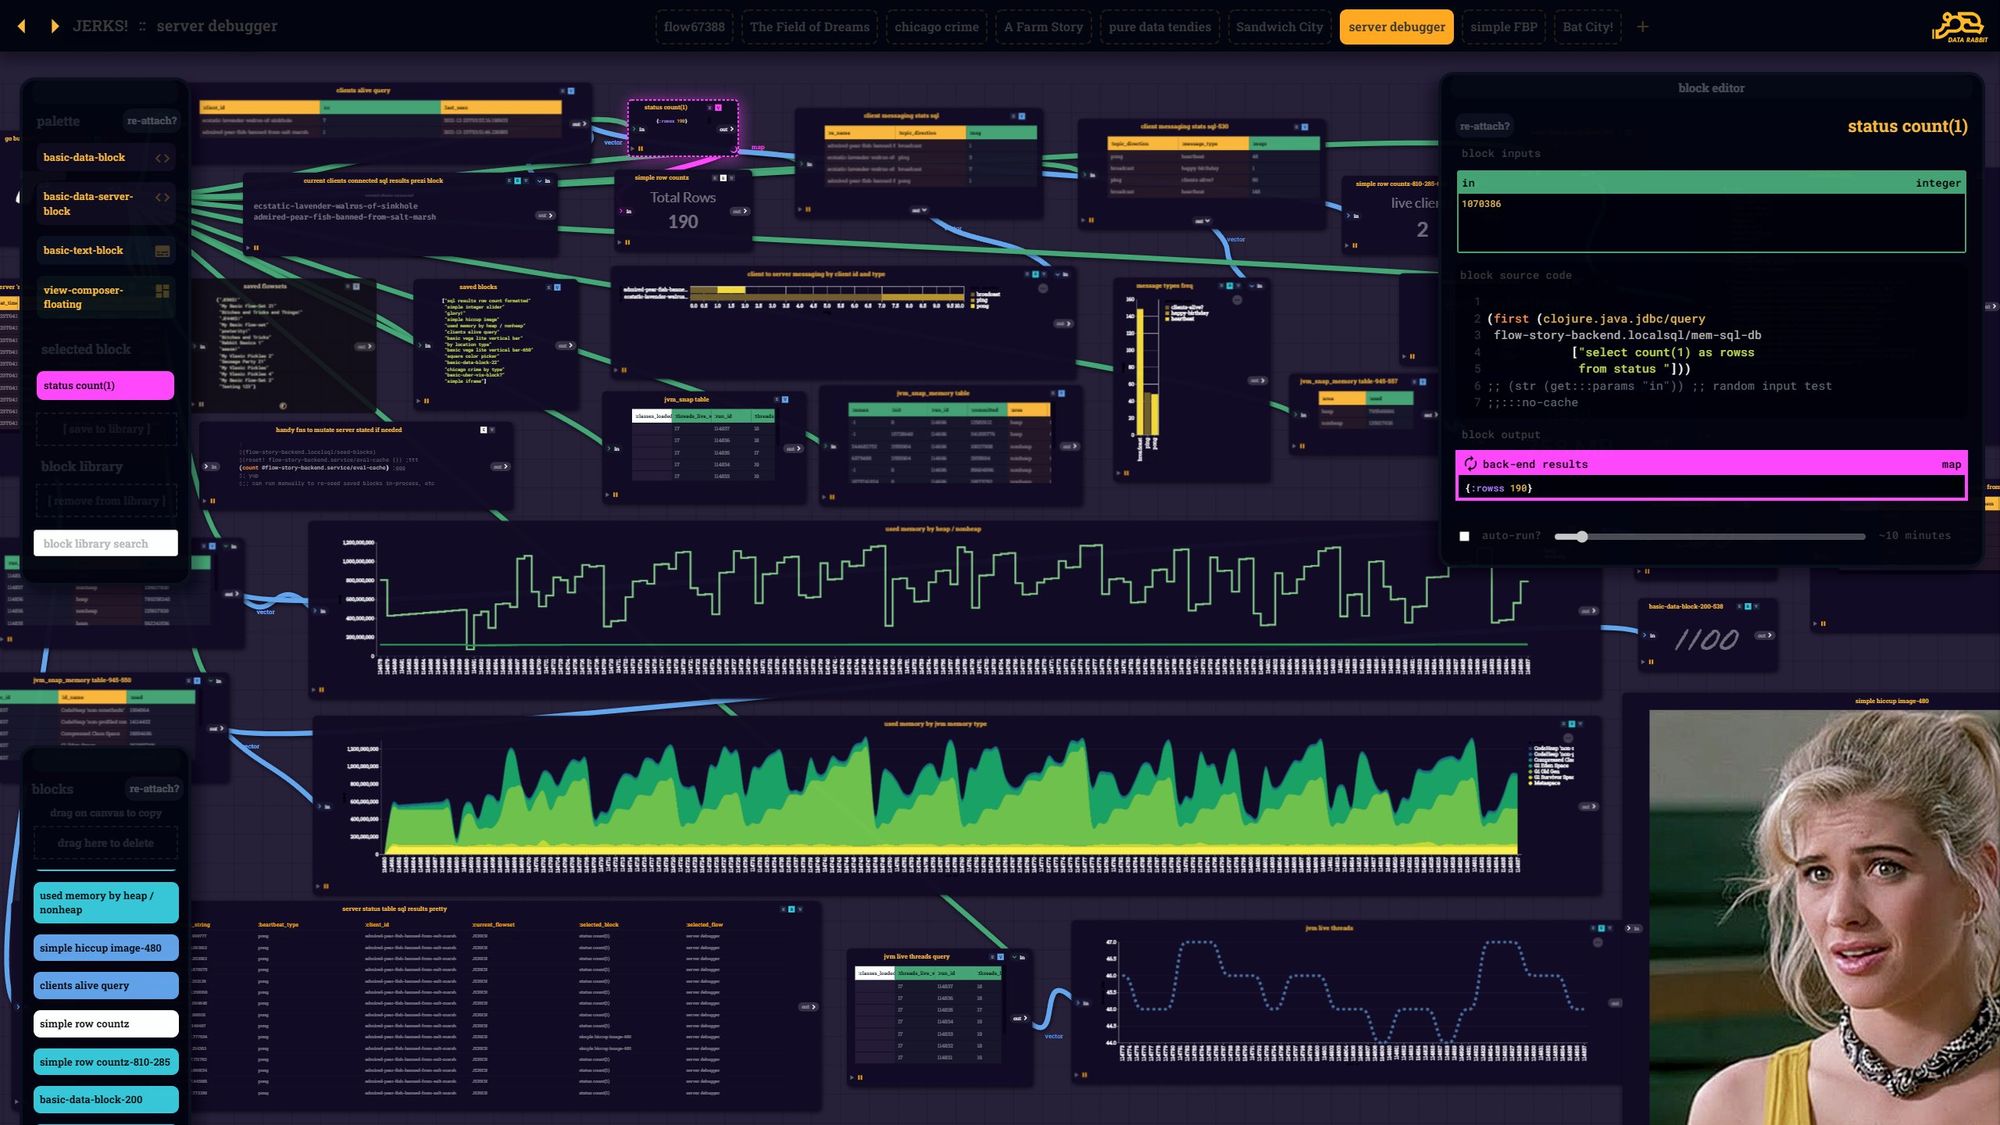
Here is a special case - since SQL is so important in my world - I wanted server code blocks to recognize JDBC connection maps and present a novel interface for pulling out simple exploratory queries from the metadata.
Not sure how you work, but I often find myself doing lots of "select *" and "select distinct" to taste the data. This expedites that even faster than my SQL IDE... plus the cached result blocks can stick around and be a visual reminder of table contents.
"Table Crawling"
A parting thought for January 2022...
It's interesting that I initially set out (during the FB prototype days) to build a "more code-aware version of Tableau for building dashboards" and ~4 years later that concept has evolved to be more like "an Unreal Engine Blueprints for data projects, visual apps and flows - in Clojure".
Quite a shift, yet in my mind it's still the same thing - just a much different set of abstractions.
Until next month, hope you all are doing amazing.